listen
In HAProxy, the listen section is used to define a frontend and backend configuration together in one block, making it a convenient way to combine both. The listen section allows you to define options specific to the listening socket and how the incoming traffic is handled. The following are some commonly used options in the listen section:
- bind: Defines the IP address and port on which HAProxy will listen for incoming traffic. For example, bind *:80 listens on all IP addresses on port 80.
- stats: Enables the HAProxy statistics page for monitoring and managing HAProxy.
- stats enable: Enables statistics monitoring for HAProxy.
- stats uri: Specifies the URI path for accessing the statistics page. For example, stats uri /haproxy_stats sets the statistics page to be accessible at http://your-haproxy-ip/haproxy_stats.
- stats realm: Sets the realm (authentication realm) for HTTP basic authentication when accessing the statistics page. This adds a layer of security to prevent unauthorized access.
- stats auth: Configures the username and password for HTTP basic authentication when accessing the statistics page. The format is stats auth username:password.
- stats hide-version: Hides the HAProxy version number from the statistics page to enhance security.
- stats show-node: Displays the server node names on the statistics page. This is useful when using dynamic server templates.
- stats refresh: Sets the interval (in milliseconds) for automatic refresh of the statistics page. For example, stats refresh 10s refreshes the page every 10 seconds.
- stats admin: Specifies the IP address and port for allowing administrative access to HAProxy statistics. It allows remote management of HAProxy using the statistics page. For example, stats admin if localhost permits access only from the local machine.
- stats maxconn: Limits the number of connections allowed to the statistics page. It helps to prevent overload and potential denial-of-service attacks.
- errorfile: Specifies a file to use as a custom error page for frontend errors.
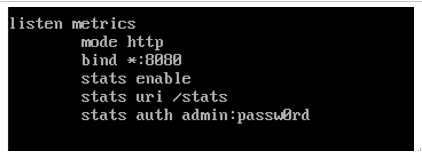
For the sample listen section, we will define it as metrics, allowing admin access from 192.168.56.1. The user will use the username as admin and the password passw0rd to log in. This is seen in the following figure:

Figure 6.6 – HAProxy listen sample
Since the status page is running on port 8080, don’t forget to add the port to the firewall and reload the firewall. This can be done with the following command;
firewall-cmd –permanent –add-port=8080/tcp; firewall-cmd –reload
How it works…
Now that we have our two web servers, and the load balancer configured, we need to start the load balancer. This is done using systemctl:
- Use the following to start HAProxy:
systemctl start haproxy
- Use the following to check the status:
systemctl status haproxy
- If you edit the config file, do not forget to reload HAProxy with the following command:
systemctl reload haproxy
Now, point your browser to the load balancer IP. You will get the web server page. This is seen in the following figure:

Figure 6.7 – Working HAProxy
Since the rule is roundrobin, and we configured the timeout at one minute, wait a minute and then reload the page. You will see a new server.

Figure 6.8 – Working load balancing
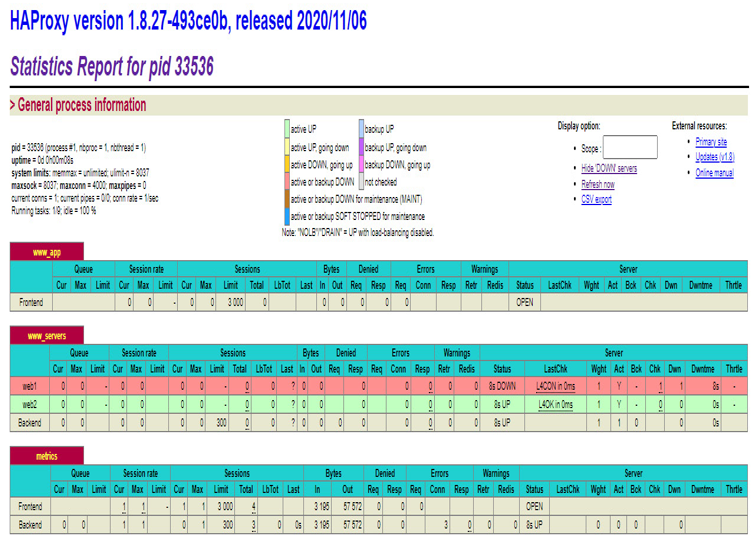
As an admin, you will also want to check on the health of your resources. Point your browser to the stats URL, and enter the username and password configured. This will show the stats page. In the case of this example, the URL is http://lb1.m57.local:8080/stats. You will see a sample in the following figure:

Figure 6.9 – HAProxy status pageOn the sample page, you will see that web1 is offline. You can also see how much traffic each frontend and backend rule has processed, and to what servers.
